|
|
|
The
RN Population, CurrentTotal Numbers in the US.
As of March 2000,
the total number of licensed RNs in the United States was estimated to
be 2,696,540, an increase of 137,666 over the 2,558,874 licensed RNs reported
in 1996. Although this was a 5.4 percent increase in the total RN population,
it was the lowest increase reported in the previous national surveys. By
comparison, the highest increase in the RN population was experienced
between 1992 & 1996 [footnote one]
when the total number of RNs increased by an estimated 14.2 percent or
319,058 (from 2,239,816 to 2,558,874). 1
footnote one. Ed Note: This
increase is part of the phenomena evident in the perceived
nursing glut, exploited by industry through the 1990s, the results
of which greatly contributed to the current crisis shortage.
Page Contents:
Associated Pages
|
|
Nursing
Stats:
RN Population US Total Numbers
and their Breakdown 1980-2000 Population
|
"The registered nurse population
increased by more than one million between November 1980 and March of 2000.
In March 2000, 2,694,540 persons were estimatedto have licenses to practice
as RNs in this country, an increase of 62.2 percent since 1980. The
years between 1996 and 2000 marked the slowest growth in the RN population
over the 20-year period between 1980 and 2000. On average, the RN population
grew only about 1.3 percent each year between 1996 and 2000 compared with
average annual increases of 2-3 percent in
earlier years. This slow down in growth
reflects fewer new entrants to the nurse population coupled with a larger
volume of losses from the nurse population than in earlier years. ...
The number of RNs not employed in nursing
changed little from 1980 to 1992, although the total number of RNs grew
substantially during those years.
However,between 1992 and 2000 the number
of RNs not employed in nursing increased about 28 percent. Between
1996 and 2000 the proportion of RNs not employed in nursing increased slightly
among the total RN population (from 17.3 percent to 18.3 percent)...
Nurse
Survey 2000 : U.S. Department of Health & Human Services Bureau of
Health Professions, Division of Nursing. Published Feb 2002.
|
Graphs
1980-2000 Inclusive :
Click Thumbnails to Enlarge
Since
1980 National Surveys of RNs have been conducted every four years.
The Following information reflects those surveys, the last having been
conducted in 2000 with its preliminary report issued in Feb 2001 and the
final published Feb 22, 2002.
|
|
Earnings
Actual
& Real
[Pre&Post
Inflation
Adjustment]
|
Employment
Full/Part
|
Employment
Setting
|
Age
|
Ethnicity/
Racial
|
Education
Basic
|
Age at
Graduation |
Education
Highest |
Education
by
Race /
Ethnicity
Highest
Prep
|

|

|

|

|

|

|

|

|

|
Click text
Hyperlink
for
dedicated
pages |
Click
Thumbnail
for
Graph |
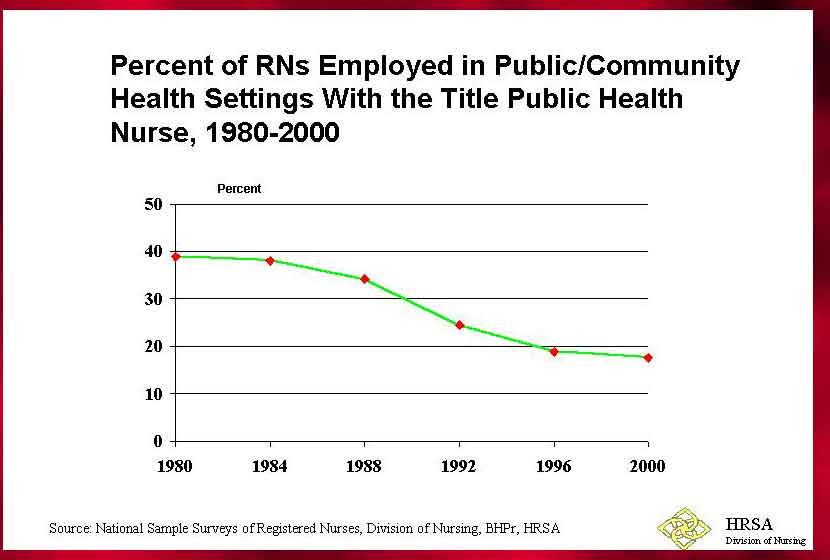
Public
Health
RNs Total
[Home Care
(PHNs)and
Govt PHNs] |
Age of
Public
Health
RNs All |
Public
Health
RNs in
GovSettings |
Public
Health
RNs
Community
[ie
HomeCare] |
Education
Public
Health
RNs
All |
Education
Public
Health
RNs
Govt
Setting |
Advanced
Practice
Prepared
RNs |
|
|

|

|

|

|

|

|

|
aaaaaaa
aaaaaa
aaaa
aaaa
aaaa
aaaa
aaa |
Registered
Nurse Pop March 2000. Results published Feb 2002:
*2,696,540 Licensed
in the USA
*2,549,638 Females
[94.6%]
*146,902 Males [5.4%]
*Average Age 45.2
[up from 44.3 in 1996]
*243,329 [9.1%]
Under 30 years old
*608.405 [22.6%]
30-40 years old
*928, 964 [34.4
%] 40-49 years old
*580,544 [21.5%]
50-59 years old
*310, 528 [11.5%]
60-69 years old
*86.6% White, non-hispanic
*4.9% AfricanAmerican
(non hispanic) *3..5% Asian (non hispanic) *0.2%NativeHawaiian/PacificIslander
*0.5%AmericanIndian/AlaskanNative *2.0% Hispanic/Latino (any race)
*1.2% Two or more
races (non hispanic)
U.S.
Department of Health and Human Services.Health Resources and Service Administration.Bureau
of Health Professions. Division of Nursing
Registered
Nurse Pop 1996
Results published
Oct 1998:
* 2,558,874 Licensed
in the USA
* 2,433,277 Females
(95.1%)
* 124,630 Males
(4.9%)
* 228,289 (9%) under
30 years old
* 711,050 (27.8%)
30 - 39 years old
* 843,757 (33%)
40 - 49 years old
* 464,749 (18.2%)
50 - 59 years old
* 293,800 (11.5%)
60+ years old
* 44.3 average age
(up from 43.1 in 1992)
* 90% Caucasian
* 4.2% African/American
* 3.4% Asian/Pacific
Islanders
* 1.6% Hispanic
* .5% American Indian/Alaskan
Native
U.S.
Department of Health and Human Services.Health Resources and Service Administration.Bureau
of Health Professions. Division of Nursing
Registered
Nurse Statistics FACT SHEET
From
the American Association
of
Critical Care Nurses Webpages
|
|
Sources for this page
[other sourcesappear at point utilized in page and within text] :
1.
"Preliminary Findings - February 2001" Provided by Seventh
National Sample Survey of Registered Nurses , National Center
for Health Workforce Analysis. U.S. Department of Health and Human Services
, Bureau of Health Professions, Division of Nursing. [conducted in 2000,
released February 2001 ].
2. Full
Study. The Registered Nurse Population 2000, purblished Feb 22 2002 Seventh
National Sample Survey of Registered Nurses , National Center
for Health Workforce Analysis. U.S. Department of Health and Human Services
, Bureau of Health Professions, Division of Nursing. [conducted in 2000,
published February 22, 2002 ].[See Full
Study March 2000 Registered Nurse Survey for the complete study ]
|
